Equipment database Vibrational Spectroscopy
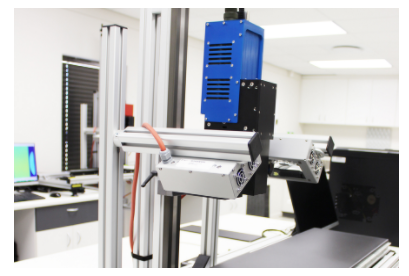
HySpex Short Wave Near Infrared (SWIR-384) hyperspectral imaging camera (single camera set up) operated by Breeze (Prediktera) Software

HySpex Visible Near Infrared (VNIR-1800) hyperspectral imaging camera (Single camera set up) operated by Breeze (Prediktera) software
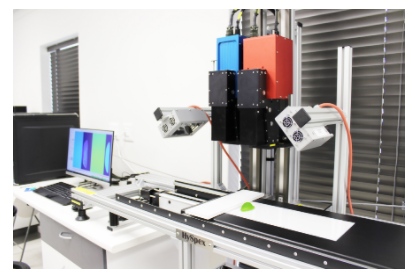
HySpex Dual VNIR/SWIR hyperspectral imaging camera set up operated by Breeze (Prediktera) software
Location
Department Food Science Room 2032, cnr Hammanshand and Helshoogte Road, Stellenbosch
Function
VNIR hyperspectral imaging cameras collect spectral absorption or reflectance data for every pixel in an image in the 400 – 1000 nm spectral range. This range includes the visible (400 – 780) colour differences and the near infrared region (780 – 1000 nm). The SWIR hyperspectral imaging camera collects spectral absorption or reflectance data for every pixel in the image in the 950 – 2500 nm range. This range includes the near infrared region.
Purpose
Spectra contain information about certain chemical and physical properties of the sample or pixel. Analysis of spectra using multivariate data analysis programs enable
1. Exploring chemical and physical differences between samples and pixels.
2. Developing models to classify samples or quantify chemicals in a sample.
Examples of classification models
Obtain samples which look similar but are chemically different for example flour and milk powder. Collect spectra from both samples to obtain a representative spectra. Use data analysis software to develop a model, which can distinguish between the flour and milk powder for new samples by applying the model to the spectra.
Examples of quantification models
Image samples and perform chemical analysis to obtain actual quantities of chemicals in a sample. For example, if the pigment concentration in apples is of interest, image apples to obtain spectra and perform chemical analysis to quantify the pigment concentration in apples. Repeat for apples to obtain samples with a range of chemical values eg 10 – 100 mg/g.
Use data analysis software to develop a model which link the spectra to the chemical values.
Collect the spectra of new samples and analyse using the model to determine the amount of pigment in the sample.
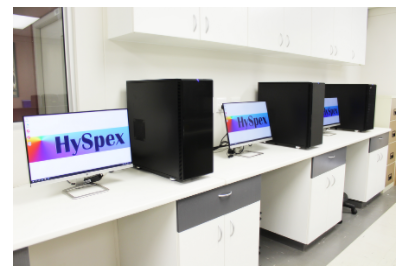
Four processing computers equipped with Evince (Prediktera) software for analysis of images and model development
FunctionVNIR hyperspectral imaging cameras collect spectral absorption or reflectance data for every pixel in an image in the 400 – 1000 nm spectral range. This range includes the visible (400 – 780) colour differences and the near infrared region (780 – 1000 nm). The SWIR hyperspectral imaging camera collects spectral absorption or reflectance data for every pixel in the image in the 950 – 2500 nm range. This range includes the near infrared region.
Purpose
Spectra contain information about certain chemical and physical properties of the sample or pixel. Analysis of spectra using multivariate data analysis programs enable
7. Exploring chemical and physical differences between samples and pixels.
8. Developing models to classify samples or quantify chemicals in a sample.
Examples of classification models:
Obtain samples which look similar but are chemically different for example flour and milk powder. Collect spectra from both samples to obtain a representative spectra. Use data analysis software to develop a model, which can distinguish between the flour and milk powder for new samples by applying the model to the spectra.
Examples of quantification models:
Image samples and perform chemical analysis to obtain actual quantities of chemicals in sample. For example if the pigment concentration in apples is of interest, image apples to obtain spectra and perform chemical analysis to quantify the pigment concentration in apples. Repeat for apples to obtain samples with a range of chemical values eg 10 – 100 mg/g.
Use data analysis software to develop a model which link the spectra to the chemical values.
Collect the spectra of new samples and analyse using the model to determine the amount of pigment in the sample.
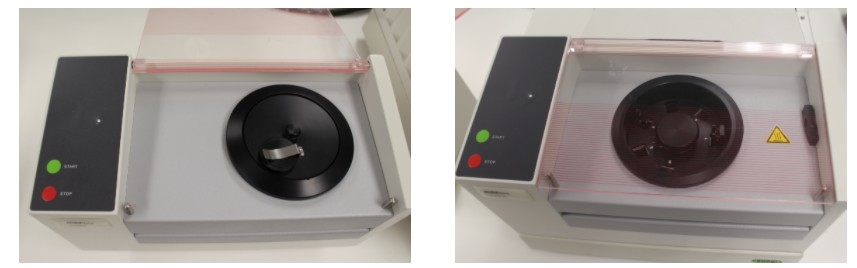
BUCHI NIRflex 500 equipped with a solid (left) and liquid (right) cell adapter to analyse solids and liquids

Function
Liquid and solid samples can be analysed to collect their absorption spectra. Whereas the hyperspectral camera collects and image containing pixels with spectra, the conventional instrument, collects one representative spectra for the sample being analysed.
Purpose
Similar to the hyperspectral imaging camera, the spectra can be analysed using multivariate data analysis program to:
Exploring overall chemical and physical differences between samples.
Develop models to classify samples or quantify chemicals in a sample.
