STRATEGIC FUND ALLOCATIONS
1. DISTRIBUTION PER STRATEGIC FUND CATEGORY PER YEAR:
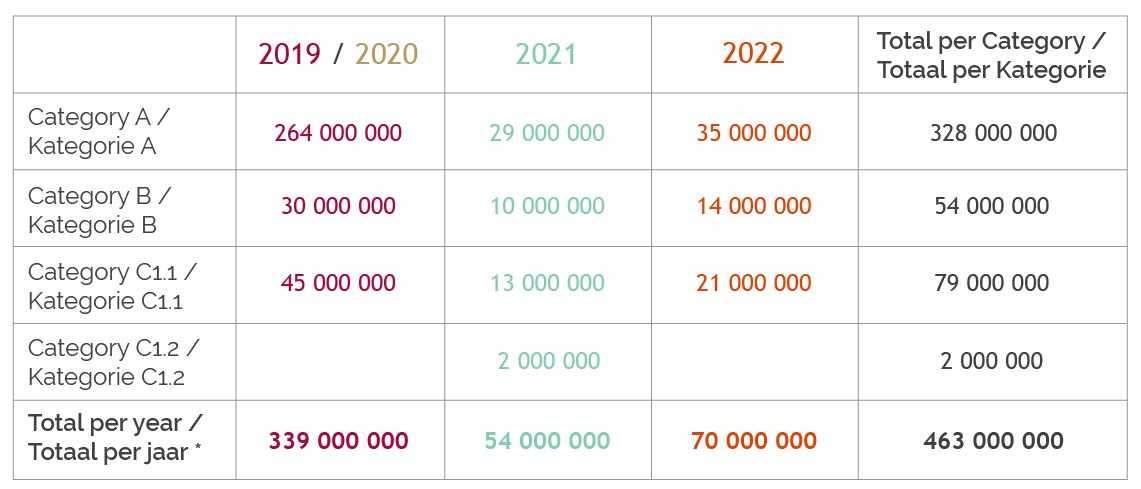
* Received annually from the 2% of the main budget that is allocated to the strategic component (which also includes the Contingency Fund).
- In 2019, additional funding was allocated.
- The 2020 contribution from the main budget was added to the 2019 amount to form a combined budget.
- Totals indicate the combined funds available for Categories A, B, C1.1 and C1.2 for that period/year.
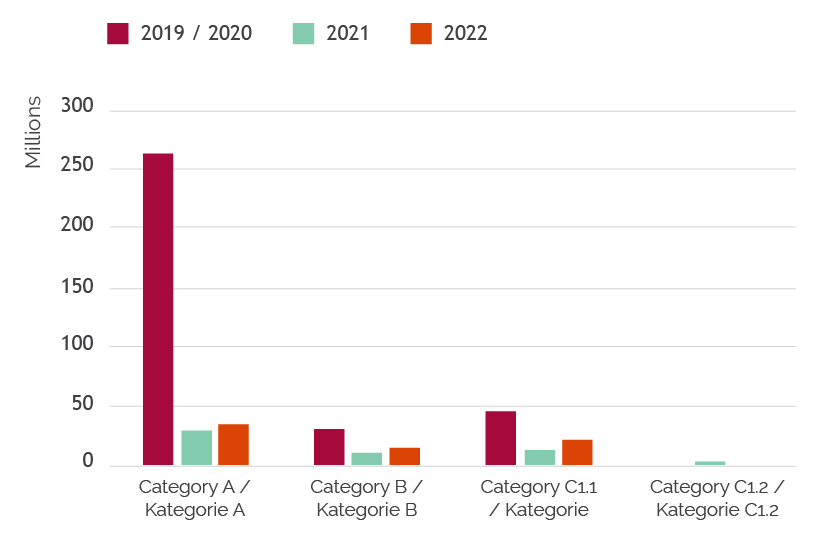
2. DISTRIBUTION PER STRATEGIC FUND CATEGORY
3. ALLOCATIONS PER YEAR (RAND VALUE)
_Table.jpg)
2019:
- 2019 was a transition period from the application of the previous Strategic Fund Regulation to that of the current Strategic Fund Regulation.
- Only R318 million of the available R339 million for 2019 was allocated; the remainder (R21 million) was transferred to 2020.
2020:
- There was an approximate over-allocation of R5 million in 2020.
2021:
- R54 million was available in 2021. After subtracting the over-allocated amount mentioned above, a final amount of R49 million was available for the application process.
- A new C sub-category, C1.2, was added in 2021. R2 million of the R15 million for the C category was allocated to C1.2, with the understanding that, if not utilised, it would carry over to the next year.
2022:
- In 2022 there were no Category B applications. Thus, only R49 million of the R72 million was allocated.
_Graph.jpg)
4. ALLOCATIONS PER YEAR (TOTAL NUMBER OF PROJECTS FUNDED)
_Table.jpg)
_Graph.jpg)
5. DIVISION PER AREA
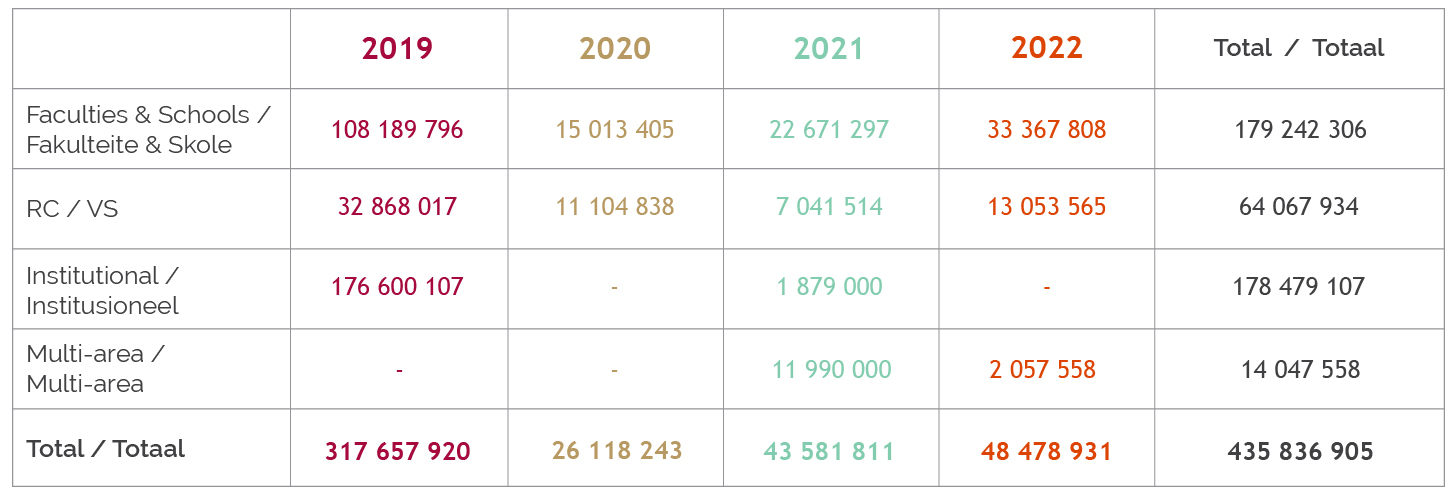
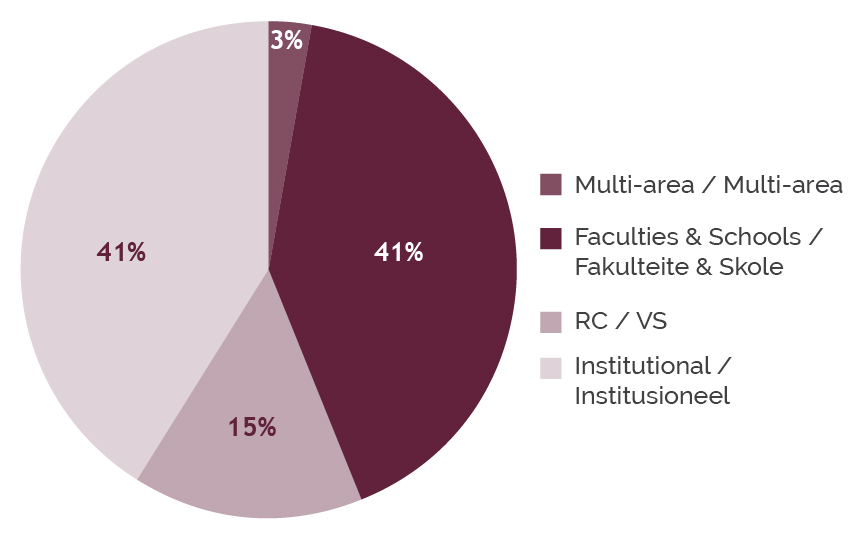
All amounts above refer to allocations across all categories (A, B and C.1.1) for that area and year.
Faculties/Schools:
- Allocations made to projects requested by faculties.
RC:
- Allocations made to projects requested by RCs.
Institutional projects:
- Allocations made to projects with an institutional mandate that are for the benefit of the institution as a whole.
- Examples:
- 2019 (SunFin, SunStudent, new website and brand, ICT, Visual Redress, etc.)
- 2021 (investigation into assessment models/methods)
Multi-area projects:
- Allocations made to projects with a combination of two or more of the above areas.
- Examples:
- 2021 (Seeding Entrepreneurism Across SU – SBS, COO [LaunchLab, Innovus])
- 2022 (MaRooN Health Passport – SITP, RIPS, Registrar)
