Data Science in the COVID-19 crisis
In order for us to understand how Data Science is used in this current COVID-19 crisis, we must understand the coronavirus and its spread. Here is a link to a video on COVID-19:
Source: https://www.youtube.com/watch?v=I-Yd-_XIWJg
Because there is no vaccine for the coronavirus yet, we must use preventative measures. These include washing your hands and social distancing. In some countries, in order to make social distancing more effective, governments have instituted lockdowns. Why do lockdowns work in reducing infection rates, and what is the effect of lockdowns? Here is a video explaining why social distancing is effective in reducing the spread of the virus:
Source: https://www.youtube.com/watch?v=8x20vBOkGNY
What does this all mean in the context of Data Science? We can see the effect of washing hands and social distancing by modelling human contact. Here is a video explaining how simulation, a mathematical modelling technique, is used to see the effectiveness of washing hands and social distancing strategies. In this example, very little data was used. It wasn’t a simulation of real human behaviour, but it allowed us to see why these strategies may be effective:
Source: https://www.youtube.com/watch?v=ZB6jajr7an0
Most of you would have heard phrases such as exponential growth and flattening the curve. Flattening the curve is reducing or flattening the number of people infected at the worst point. This helps because if fewer people are infected at any time, there is a higher chance that they could receive hospital or clinical treatment without overburdening the health-care system, because every health-care system operates under multiple constraints. Some of the important constraints in health-care systems are the number of hospital beds and the maximum number of patients who can be seen by doctors on any given day. Here is a video explaining flattening the curve: https://healthblog.uofmhealth.org/wellness-prevention/flattening-curve-for-covid-19-what-does-it-mean-and-how-can-you-help
So how do we estimate the increase in positive COVID-19 cases every day? Here is an excellent video on how we model the growth in the number of new cases in any given day:
Source: https://www.youtube.com/watch?v=Kas0tIxDvrg
When a virus spreads on an exponential growth basis, we can go from 1% of the population being infected to 70% in a matter of days. It depends on the growth rate. So, the natural question to ask is whether growth rate for the virus is the same across the world? The answer is no. This is because living spaces, cultural behaviours and governmental rules are different across the world. One can imagine that a dense city will experience a higher rate of virus spread than a sparsely populated rural area (if all else is equal). In some countries, people distance themselves socially as cultural behavior. This is one reason why scientists believe Sweden has had a lower transmission rate than other countries. Click here for an article explaining this.
So you can see from the above that Data Science has been an integral part of the fight against the coronavirus pandemic. Where else has Data Science been useful in this space? Data is an important tool to inform the public. Check this tool that was created to inform us of the spread of the virus in South Africa.
A favourite website for information during this crisis has been: https://tinyurl.com/qngxegv. If you go further down the page, it shows how many new infections have been identified across each country that is reporting its data. You can also click on each country to see the situation in each of them. On March 31st, the data showed the total number of new cases across the world was still on the increase:
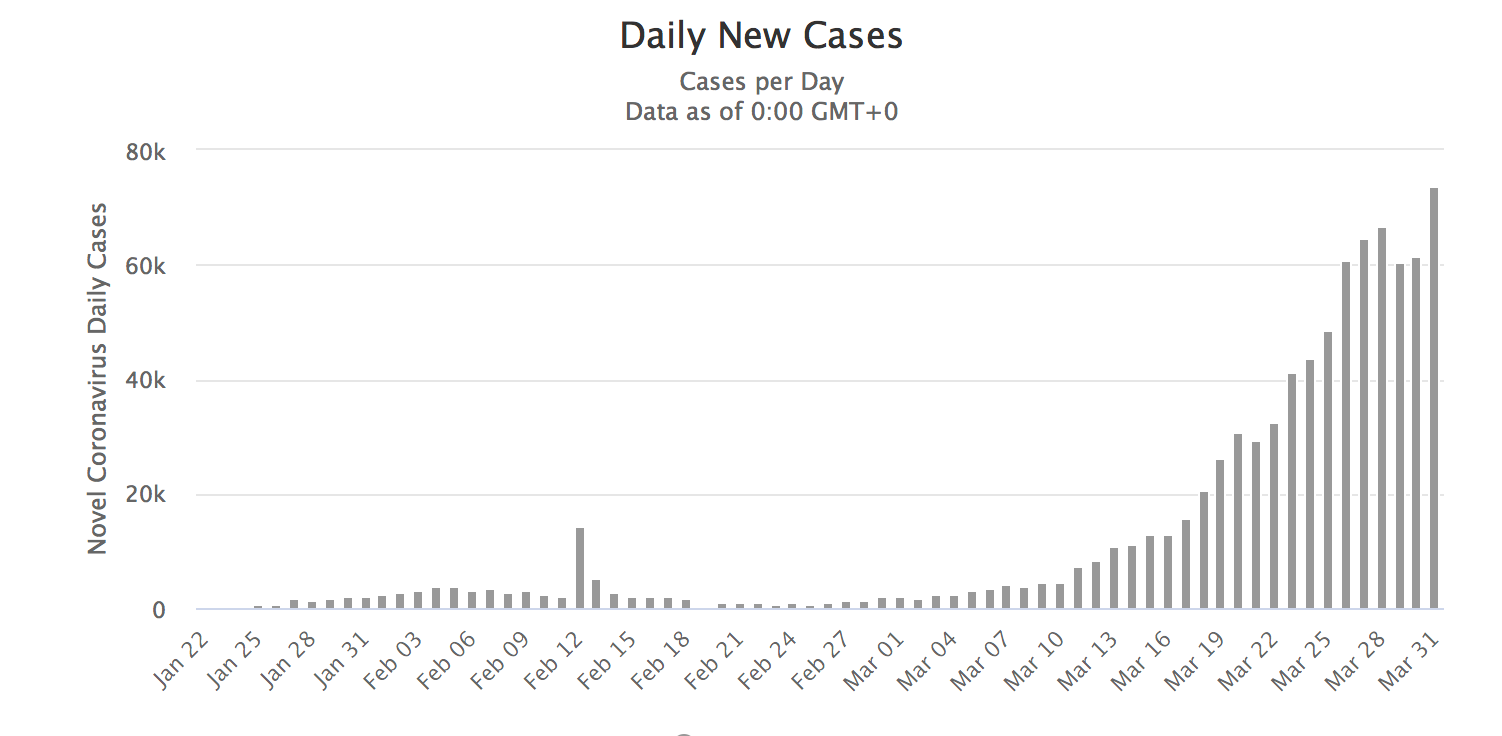
Source: https://www.worldometers.info/coronavirus/coronavirus-cases/#daily-cases (31-03-2020).
The increase on March 31st paints a grim picture. However, if you had to plot this graph for every country, one would see that some countries were containing the virus quite effectively with a low mortality rate. Additionally, some countries are experiencing low infection rates. This is where Data Scientists would communicate with other specialists, such as with policy makers, doctors and epidemiologists, to determine whether these lower infection rates were due to fewer tests being done or due to strategies containing the spread of the virus. Now, take a look at the daily increases for the USA, or more specifically New York State. This information could help governments direct aid and funds to where it is most needed. These are examples of how data and Data Science can be used in solving this pandemic crisis.
As you can see, Data Science is an essential tool in this fight against the virus. Hopefully, the above has awakaned your interest in finding out more about Data Science and Computational Thinking. If this resource has been useful to you, let us know at kanshu@sun.ac.za.
